
Monitoring and Compliance
Agent Control Center (ACC) Monitoring and Compliance Manual
This document is designed to provide guidance on how to effectively monitor and ensure compliance with key performance indicators (KPIs) within the ACC platform. By following the procedures outlined in this manual, users can review and monitor the success of their jobs, ensuring optimal performance and adherence to organizational standards.
Overview of Agent Control Center (ACC):
The ACC serves as a centralized platform for managing agents, scheduling runs, and monitoring job performance. It offers a range of features and tools to facilitate efficient data extraction and processing.
Monitoring Key Performance Indicators (KPIs):
Accessing Monitoring Tools: Access the ACC Web Portal to monitor agent operations.
Managing Jobs in ACC Web Portal:
Once you deploy your agent to a cluster, you can create Jobs and Job Schedules, configure Job Settings, view Job History, etc.
The 'Jobs' which you can find at the dashboard actually refer to the running, failed, scheduled and succeeded jobs. From here, you will see if a job has run successfully or has failed and what is the 'Last Run/Next Run/Started/Completed' time.
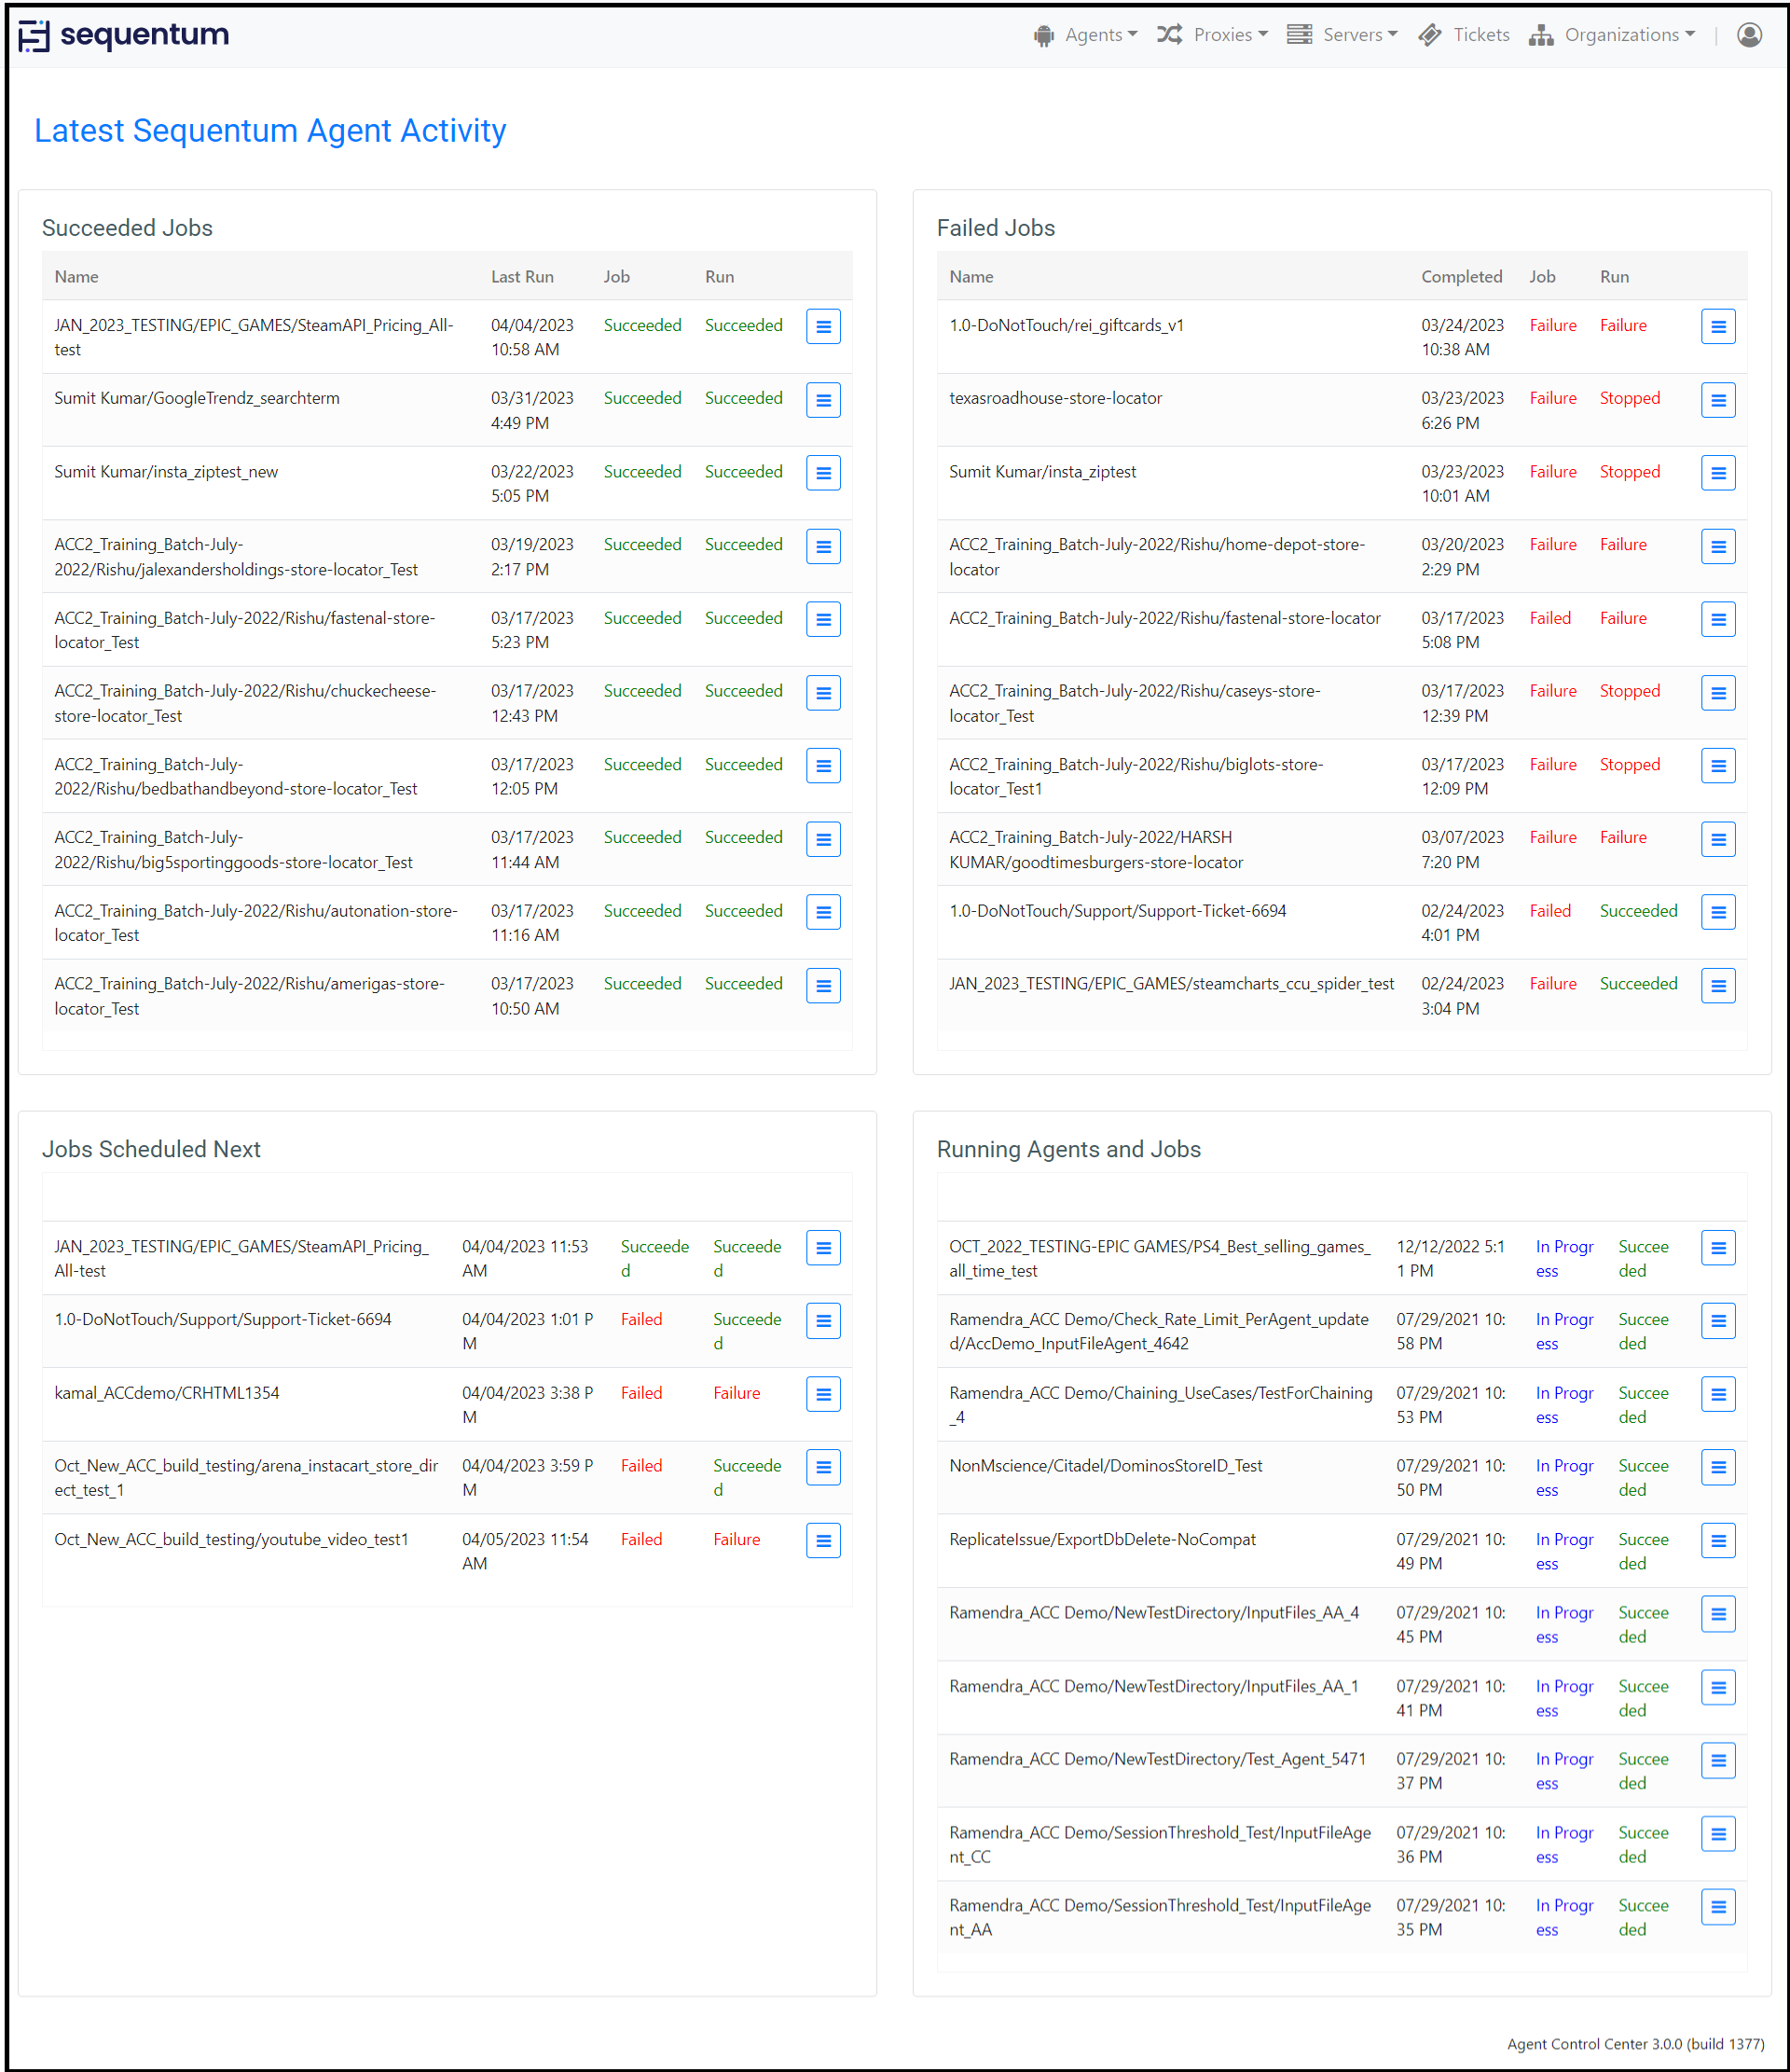
You can click the icon that comes at the end of each job to check out the 'Agent Run History', 'Job History' and 'Job Schedules'. The 'View in Repository' button provides you users the key info of the selected job, such as the version of the Agent, the Server/Cluster that the job is associated to, the Proxy Pool bundled with the job, whether Success Criteria is enabled, Rate limit applied or not, when was it Last updated, status of Job and Run, what are the Tickets created for the job.
Navigate to Agent Repository:
Navigate to the Agents section to view agent repositories, run history, and job schedules.
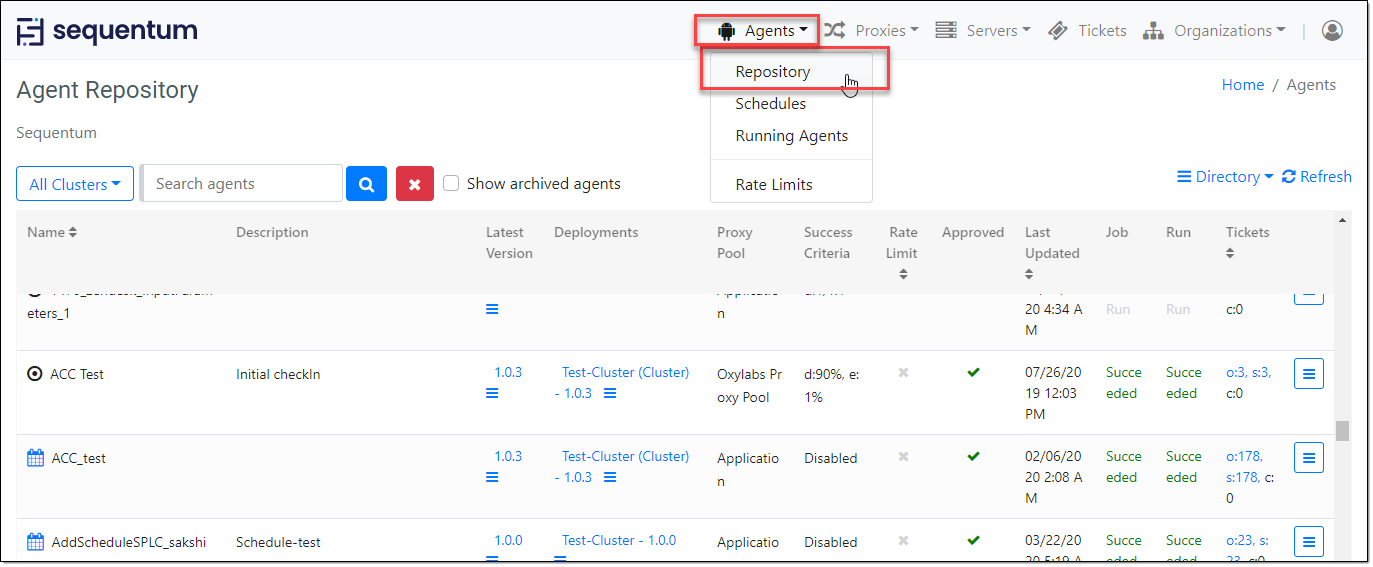
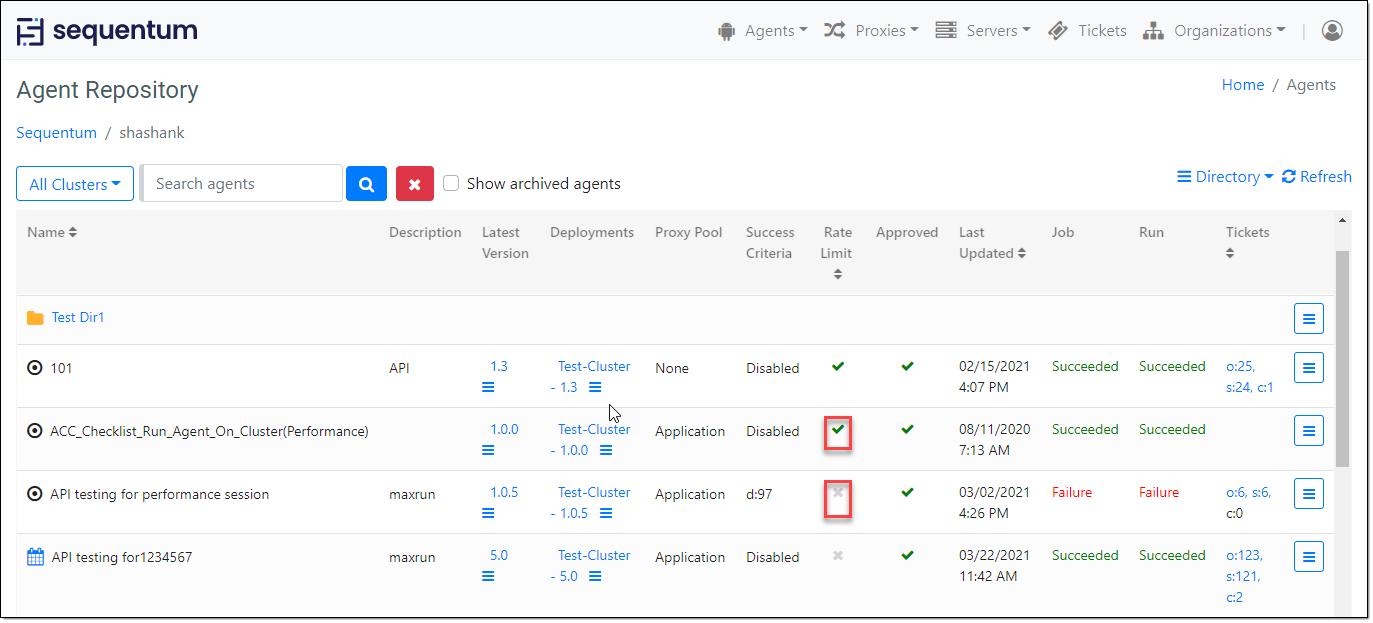
Agent Repository in the ACC Web Portal offers a feature-rich web-based interface that allows you to view, organize and maintain your agents, as well as deploy, schedule, run and monitor them via a web browser.
Navigate to Agents -> Repository in order to access Agent Repository.
Key Features for Monitoring:
The ACC provides several key features to facilitate monitoring and compliance, including:
Run History and Job History: Review the execution history of agents to track start/end times, actions performed, errors encountered, and data extracted.
Audit Logs: Records of system activities for tracking changes and ensuring accountability.
Schedules: Configurable schedules for automating job runs and ensuring timely execution.
Success Criteria: Criteria for determining job success and compliance with performance standards. Please read the following articles for more details:
Job Settings->Enable Success Criteria
Rate Limits: Enforce rate limits to Control agent access to target websites by setting maximum page load limits over time.
Run History:
This command allows you to view the Run History of the agent. Run history page displays the complete run history of the agent job schedule.
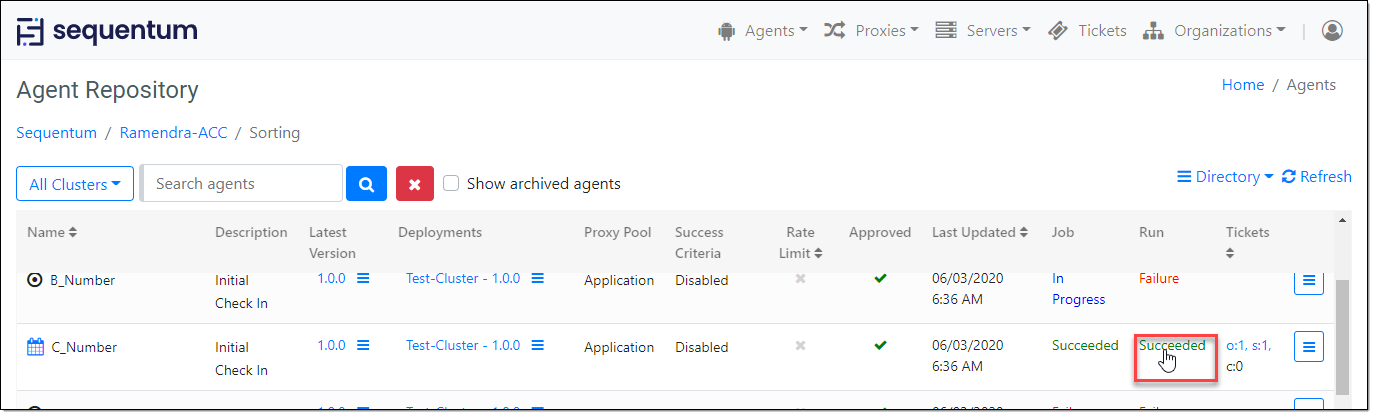
You can navigate to the Run history page via the below option:
Agents→Repository→Run status (Showing under Run column)
By clicking the 'Run History', you should see the Run History of the selected Agent.
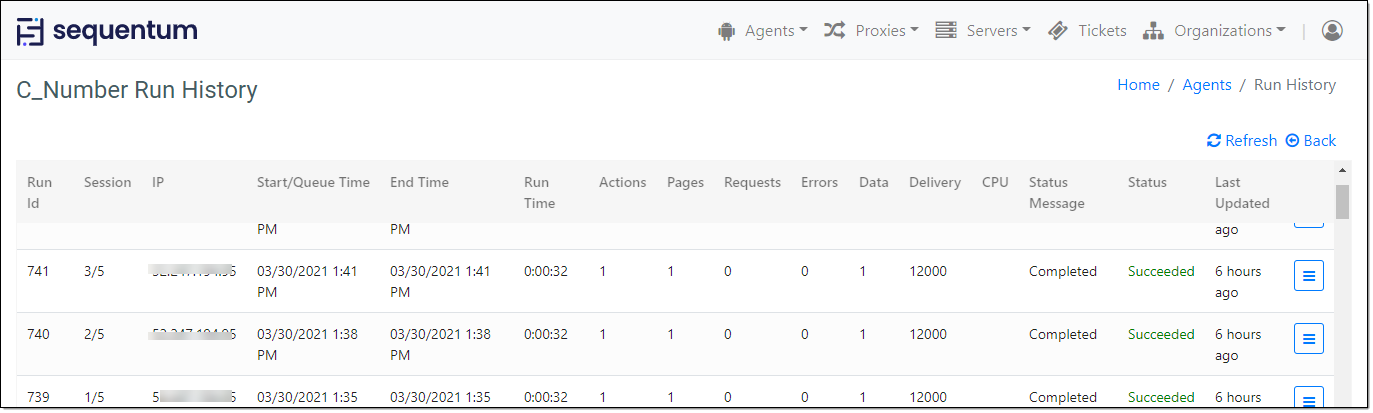
The agent Run History report contains the following columns:
RunId: This column shows an increasing number for each row w.r.t the agent run.
Session: This column shows sessions of agent run.
IP: This column shows server IP associated with the cluster on which the agent executes.
Start/Queue Time: This column displays the date and time at which the run started executing on the cluster.
End Time: This column displays the date and time at which the run finished its execution on the cluster.
Run Time: This column displays the total execution time of the run.
Actions: The successfully executed action commands.
Pages: Actual page loads. This is all pages that are loaded into the main-frame of the browser or pages loaded by the HTML/JSON/XML parser.
Requests: All requests made to the target web server, including HTML, images, styles, script, etc. For HTML/JSON/XML parsers there's one request per page load.
Errors: All action errors. Note that a page load error that's retired and then successful does not result in an error, but the error counts as a page load if a page was actually loaded.
Data: The number of records that have been extracted
Delivery: Actual count of the data rows delivered to the destination endpoint.
Status Message: This column describes the agent run status.
Status: This column shows the run status as Failure or Succeeded.
Last Updated: This column shows the date and time of the last executed run.
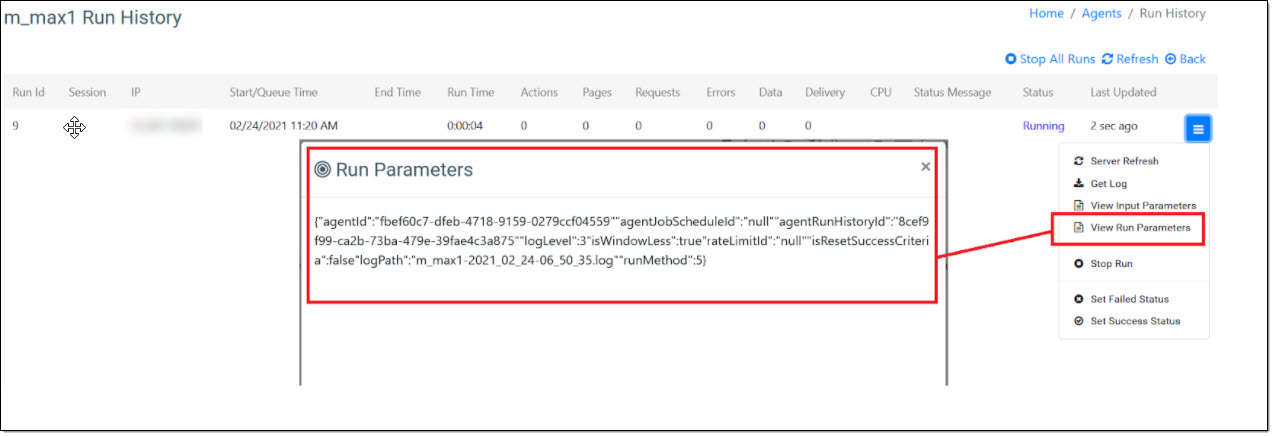
Run History Context Menu
For each row, under the run history page, there are several context menu options that can be used to manage the agent execution, check logs, download export data, and manage agent run status.
Get Log: Click on this option and it will open a new window with log contents of the agent run.
Get Data: Click on this option and it will download your export data in a compressed zip format allowing you again to view the output data without having to go to the server for checking the export data.
View Input Parameter: Click on this option to view the parameter named values that get their value assignments when an agent starts.
View Run Parameter: This open added in the context menu of Run History allows users to view all the run parameters.
Restart: Click on this option if you want to restart your agent.
Retry Errors & Continue: This is a useful option in case your agent encountered any failures and you want to only retry the failures/errors and don't want to restart the agent again. Click on this option and the agent will retry the errors and will continue the agent execution for the failures.
Set Failed Status: Use this option to set the run status to failed which allows the users to stop the agent execution.
Set Success Status: Use this option to set the run status to success if it failed in the last execution and the next run execution is getting blocked due to the failed run status.
Schedules
Once your agent is successfully deployed to a cluster, you can schedule it to run automatically on a regular basis.
Please read the following article for more details:
Running Agents
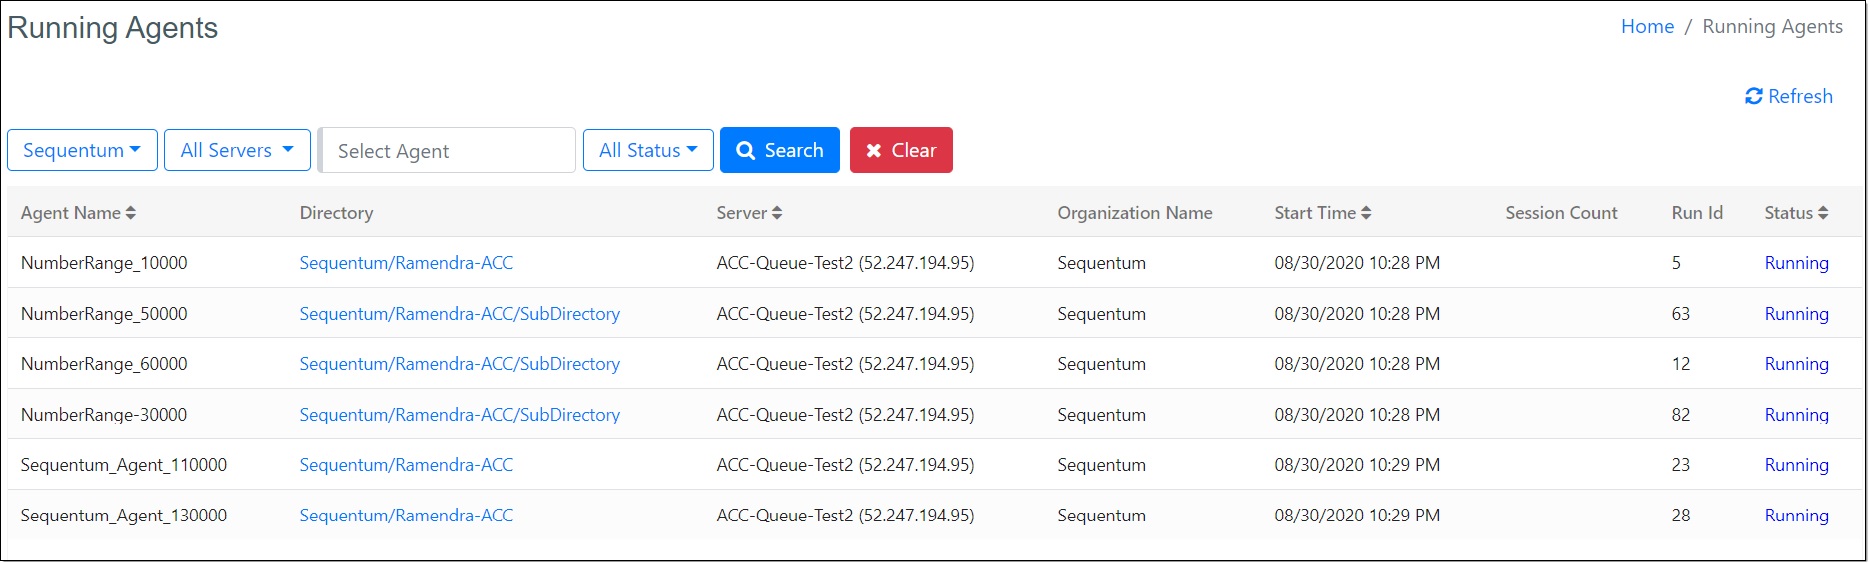
Click on Agents -> Running Agents tab to see all the running agents for an Organization. A user with Admin privilege is only allowed to see the running agents in an organization. However, Super Admin privilege can see the running agents across all the organizations.
The Running Agents page is the central place where we can see the execution-related information for all the agents such as agents that are in Running, Queued, or in starting mode.
There is also a provision of a filter option on the Running Agents page so that the users can prioritize the search results on the basis of Organization Name, Server Name, Agent Name, and Status. This filter option is available on the Running Agents page.
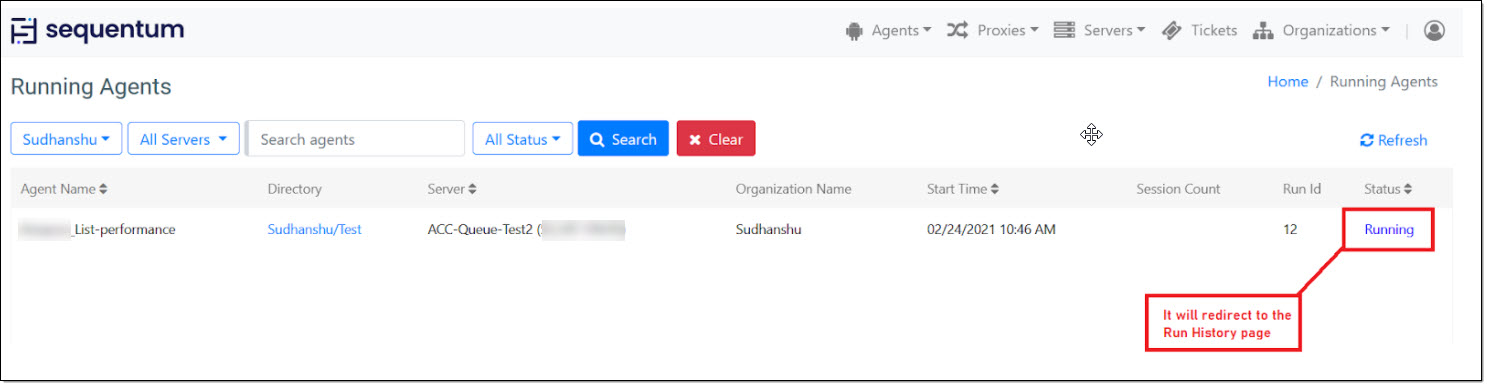
We have an option to navigate the Run History page from the Running Agents page . We can achieve this by clicking on the link "Running" under the Header name "Status".
Rate Limits
Rate limits are used to control how hard the agents are allowed to hit a target website. For example, a rate limit can be added for a certain website and be configured to allow a maximum number of page loads over a given time period. The rate limit is then assigned to all agents targeting this website, and the agents will stop once the maximum number of allowed page loads is reached.
A rate limit can be assigned to an agent by clicking on the check or cross icon in the Rate Limit column in the agent repository.
Please read the following article for more details:
Job history
The job history page displays the execution history of the jobs that were scheduled to run on a cluster. You can navigate to the job history page via below option:
Agents→Schedules→Context Menu→Job History
The values displayed under each column of the job history page is explained as below:
RunId: This column shows an increasing number for each row w.r.t the jobs executed.
Start Time: This column displays the date and time at which the job started executing on the cluster.
End Time: This column displays the date and time at which the job finished its execution on the cluster.
Schedules: This column displays the count of job schedules that got executed. This column will display 1/1 for each row if the Job Settings is set with "one job per schedule" and will display the count of all the schedules that got executed again the job schedules for a particular agent.
Runs: This column displays the count of runs that got executed for a particular job schedule.
Actions: The successfully executed action commands.
Pages: Actual page loads. This is all pages that are loaded into the browser or pages loaded by the HTML/JSON/XML parser.
Requests: All requests made to the target web server, including HTML, images, styles, script, etc. For HTML/JSON/XML parsers there's one request per page load.
Errors: All action errors. Note that a page load error that's retired and then successful does not result in an error, but the error counts as a page load if a page was actually loaded.
Data: The number of records that have been extracted by the agent. This count can be different if the "Increase Data Count" property is manually configured, else the count will be based on the increased count on each extracted content element.
Delivery: Actual count of the data rows delivered to the destination endpoint.
Error Message: This column displays the error message of job failure.
Status: This column displays the execution status of the job which can be In Progress, Succeeded, Failed.
Additionally, you can navigate to the run history page by going to the View Run History link available under the context menu for each row under the job history page.
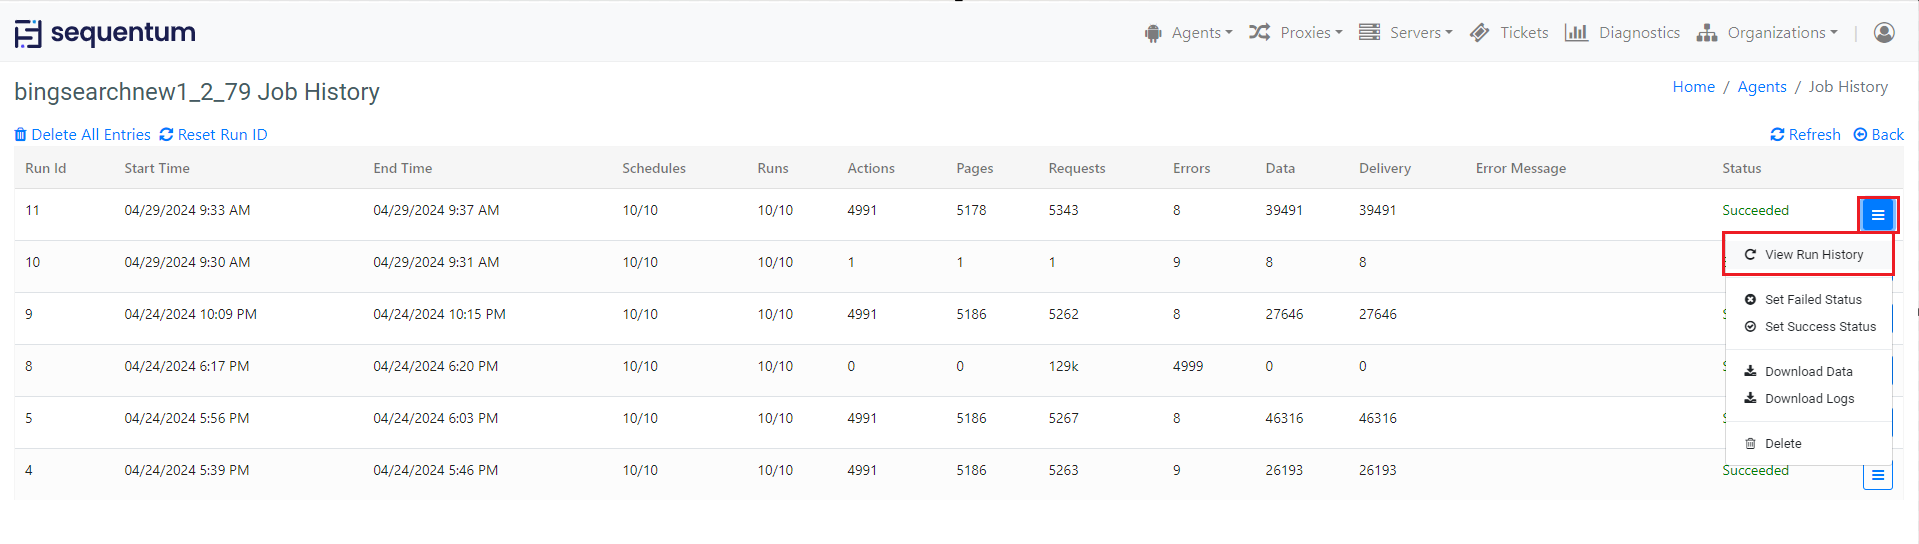
Also, you can manually set the job status to failure or success which allows the users to stop the job execution or continue the job execution basis the last job execution status.
Success Criteria: Set and monitor success criteria such as minimum data count, maximum errors, and export rows to ensure job success.
Delivery: Monitor the actual count of data rows delivered to the destination endpoint to verify data delivery accuracy.
Agent Status: Check the status of agents to ensure they are running successfully and meeting performance expectations.
Job Schedules: Review job schedules to track when agents are scheduled to run and ensure timely execution.
Audit Logs: Access audit logs to track changes made to agents, deployments, and job configurations for compliance purposes.
In the realm of "Monitoring and Compliance," it's crucial to understand how websites utilize robots.txt files to dictate how web crawlers navigate their content. By configuring agents to adhere to these rules and utilizing robots.txt rules to accurately represent the business, organizations ensure transparency and compliance with website publishers' guidelines. This brief overview emphasizes the importance of configuring robots.txt rules within the Agent Properties panel for effective monitoring and adherence to compliance standards.
Please read the following article for more details:
Obeying Robots Rules
Conclusion:Monitoring and compliance are essential aspects of managing operations within the Agent Control Center. By monitoring key performance indicators (KPIs) and ensuring compliance with organizational policies and industry regulations, users can optimize job performance, maintain data integrity, and achieve operational excellence.
This manual serves as a guide for clients to effectively monitor and ensure compliance within the ACC platform, enabling them to review and monitor the success of their jobs with confidence.