
Testing/Debugging an Agent
The Agent Debugger is an essential tool when trying to locate and correct issues in an agent. Running an agent through the debugger is normally the first thing you do after you have built your agent.
The debugger will warn you of any potential issues while it's running an agent, and allow you to pause and correct issues.
An agent runs significantly slower when using the debugger, and the debugger does not automatically manage JavaScript memory leaks and hanging/crashing web browsers, so you should only use the debugger for testing, and not for full agent runs.
Refer to Using the Debugger for more detail.
Logging
Logging is used to collect detailed information about the web scraping process and can be used both when debugging and running an agent. Logging includes links to the web pages that are being processed, so it's easy to pinpoint pages that may be causing problems.
Refer to Using Logging for more detail.
Using the Debugger
The agent debugger is used to test your agent, and to find and correct issues such as missing content elements.
When building an agent, you often base the design of the agent on just a few web pages, and then rely on Sequentum Enterprise to execute your commands on all similar web pages it encounters.
For example, if you are extracting data from a product catalog, you may select the product name and price on a single product detail page and add agent commands to extract those two web elements. Sequentum Enterprise will then use these two agent commands to extract product name and price for all product detail pages in the product catalog. This works fine in most cases, but some products may be on special, and the product detail pages for those products may display the price differently. Sequentum Enterprise may be unable to pick up the discount prices and the price for some products may, therefore, be missing. Even if you know that some products have a discount and need special attention, it may be difficult to find such a product page in a large catalog.
The agent debugger can help you correct issues where an agent is unable to locate content because it stops and warns you when content is missing and allows you to correct the agent command that caused the error. In the product catalog example, you would be able to correct the agent command that extracts the price, so it includes a selection for the discounted price.
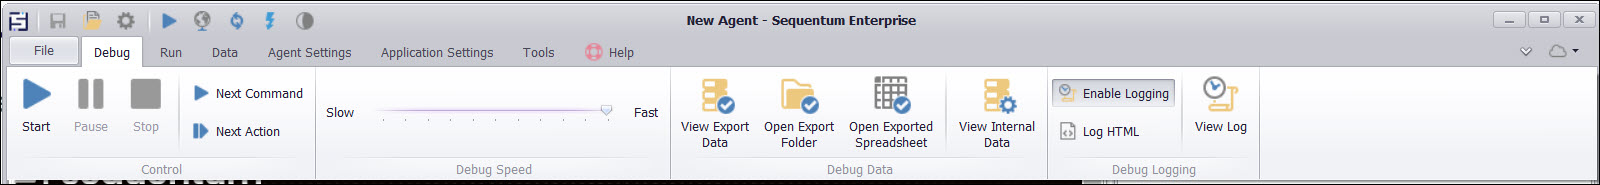
Controlling the Debugger
Use the Start button in the Debug ribbon tab at the top of the Sequentum Enterprise application to start the debugger.
The agent will run directly in the agent editor, so you will be able to see the web pages being loaded into the web browser. The debugger will mark the content that is being processed in the web browser, and it will also highlight the command that is being executed, in the Agent Explorer panel.
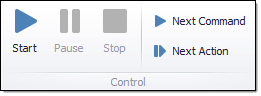
Once the agent is running in the debugger, you can pause or stop the debugger at any time. If you pause the debugger, you can use the Next Command button to execute one command at a time, and the Next Action button to execute commands until the debugger reaches an action command.
Setting the Debug Speed
The debugger will mark the content that is being processed in the web browser, which is helpful when trying to work out how the agent is processing the website, but the debugger may run so fast that it's impossible to see what's going on. You can slow down the debugger to make it much easier to follow the process.
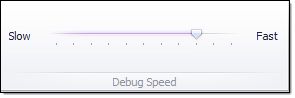
Debug Speed controller
You can change the debug speed before you start the debugger or while the debugger is running.
Debug From a Specific Command
Sometimes you may want to only debug a small part of your agent. If you have a complex agent that processes a large website, it may take a long time before the debugger reaches the desired part of your agent you wish to test. So instead of starting from the beginning, you can select the agent command where the debugger should start.
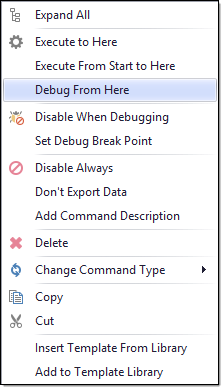
Selecting "Debug From Here" from the Agent Command Context menu
When you start debugging from a specific command, the web browser tab that is associated with the command must have a web page loaded. You cannot start debugging from a blank web page.
Disable a Command While Debugging
When debugging a complex agent that processes a large website, it's often useful to exclude parts of the agent, so you only execute the part of the agent you want to test. you can do this by disabling commands while debugging.
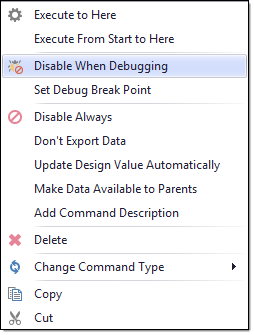
Selecting "Disable When Debugging" from the Agent Command Context menu
When you disable a container command such as Agent, Navigate Link, Navigate URL, Data List, Web Element List, Group Commands, Group Commands in Page Area, Crawl Website, Set Form Field all sub-commands are also automatically disabled.
This setting is automatically saved to the agent command, so the command will be disabled every time you debug the agent until you enable the command again. This setting has no effect when you run an agent, only when you debug the agent.
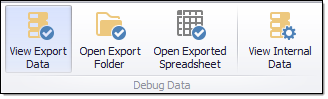
Viewing Debug Data
Data collected while debugging an agent is saved to a separate data store, so it doesn't overwrite data that is collected when you run the agent. The debugger will export data to your chosen export target, but it will never distribute data. If you are exporting data to a database, the debugger will create separate data tables for the debug data. If you are exporting data to a file format, the files will be written to the agent's debug data folder.
Important: If you are using a script to export data, you are responsible for managing debug data if you want to separate debug data from normal data.
Please see the Data topic for more information about agent data.
Using Logging
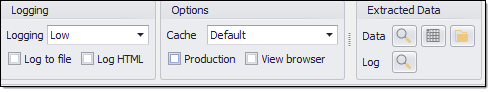
Logging can be used when debugging or running an agent to collect information about the web scraping process. Logging can be set to three different detail levels, Low, Medium and High. The Low detail level only logs errors, Medium detail level logs errors and warnings, and High detail level logs errors, warnings, and general progress information. Debug logging is always set to High detail level and cannot be changed.
Debug log data is stored in a separate data store, so it doesn't overwrite or get mixed with normal log data.
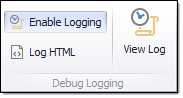
Debug logging can be turned on in the Debug ribbon menu.
Normal logging can be turned on when running an agent on the Run Agent screen.
The Run Agent screen is not displayed when running an agent using the Run button in the application menu, so you will not be able to configure logging when running an agent this way.
Logging Raw HTML
Sequentum Enterprise automatically logs direct links to processed web pages when logging is turned on, so it's normally easy to view specific web pages that have been processed. For example, if an error or warning appears in the log, you can simply click on the associated URL to open the web page and see if there is anything special about the page that may cause an error.
Sometimes it's not possible to open a web page using a direct URL. For example, some websites implement CAPTCHA protection. This is web pages that appear randomly to ask the user to enter a verification code. before proceeding If a CAPTCHA page is retrieved instead of a normal web page, your agent is likely to encounter errors, but if you click on the associated URL later, you may not get the CAPTCHA page because it appears randomly. In this case, it may be difficult to determine what is causing the error, but you can use the Log HTML feature to log the raw HTML of all processed web pages, and this will allow you to view the CAPTCHA page. Please see the CAPTCHA topic for more information about CAPTCHA.
Error Handling
Please see the Error Handling topic for more information about error handling, notifications, and logging.