
Diagnostics
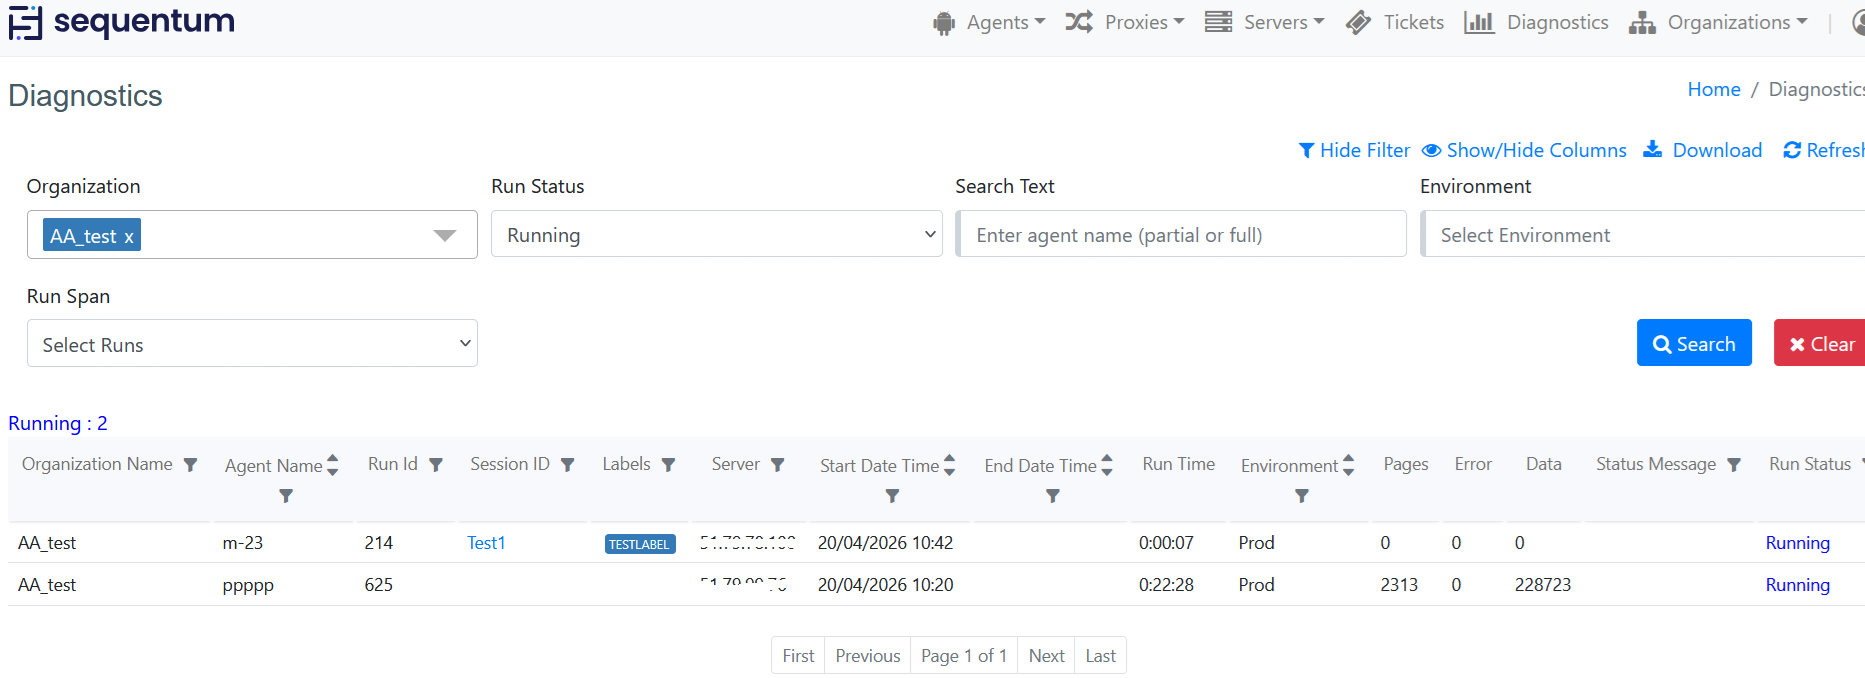
The Diagnostics page allows users to filter and view the status of jobs and runs based on the filter criteria. Following details shows the instructions on how to use the filtering options and understand the displayed results.
Filters
Organization - Displays the current organization name. Super Admin users can select multiple or all organizations using checkboxes.
Default: Displays the current organization by default.
Run Status - Filters results based on the status of agent runs.
Options: All Status, Never Run, Queued, Running, Succeeded, Failed.
Behavior:
Select only one status at a time.
"Starting", "Running", "Stopping", and "Delivery" statuses are grouped under "Running".
"Stopped", "Failed", "Failure" statuses are grouped under "Failed".
Default: Displays results for "Running" status by default.
Search Text - Enter full or partial agent name to filter results based on matching keywords.
Environment - Filters the results based on the selected environment, such as Dev, Prod, or QA. By default, no environment is selected, and runs from all environments will be displayed based on the other applied filters.
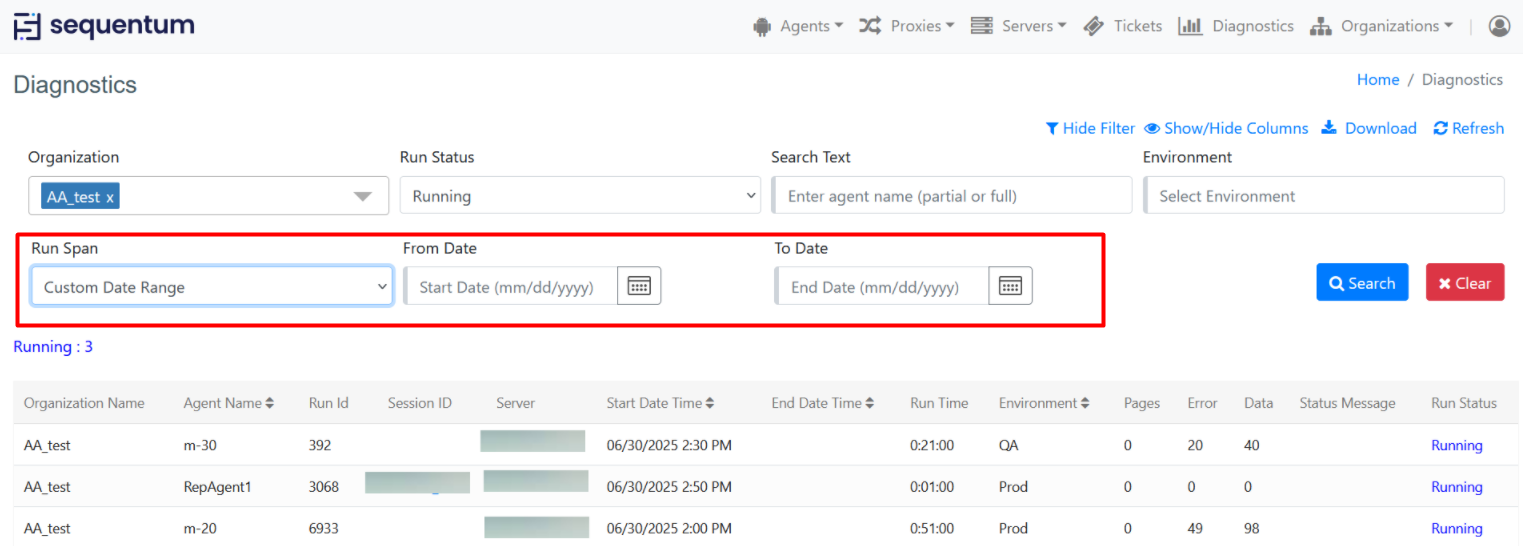
Run Span - Filters results based on the timeframe of agent runs.
Options:
Active Runs Only
Runs for Today
Runs for 2 Days Ago
Runs for 3 Days Ago
Runs for 4 Days Ago
Runs for 5 Days Ago
Custom date range (select From and To dates)
Result columns - The results table displays the following columns:
Organization Name
Agent Name
Run Id
Session ID
Labels
Server
Start Date Time
End Date Time
Run Time
Environment
Pages
Error
Data
Status Message
Run Status
Applying Filters and Searching
Applying Filters:
Select desired options from the Organization, Run Status, Search Text, and Run Span filters.
Click on the search button to apply filters and display results.
Clearing Filters:
Use the clear button to reset all filters and display the default view.
Notes
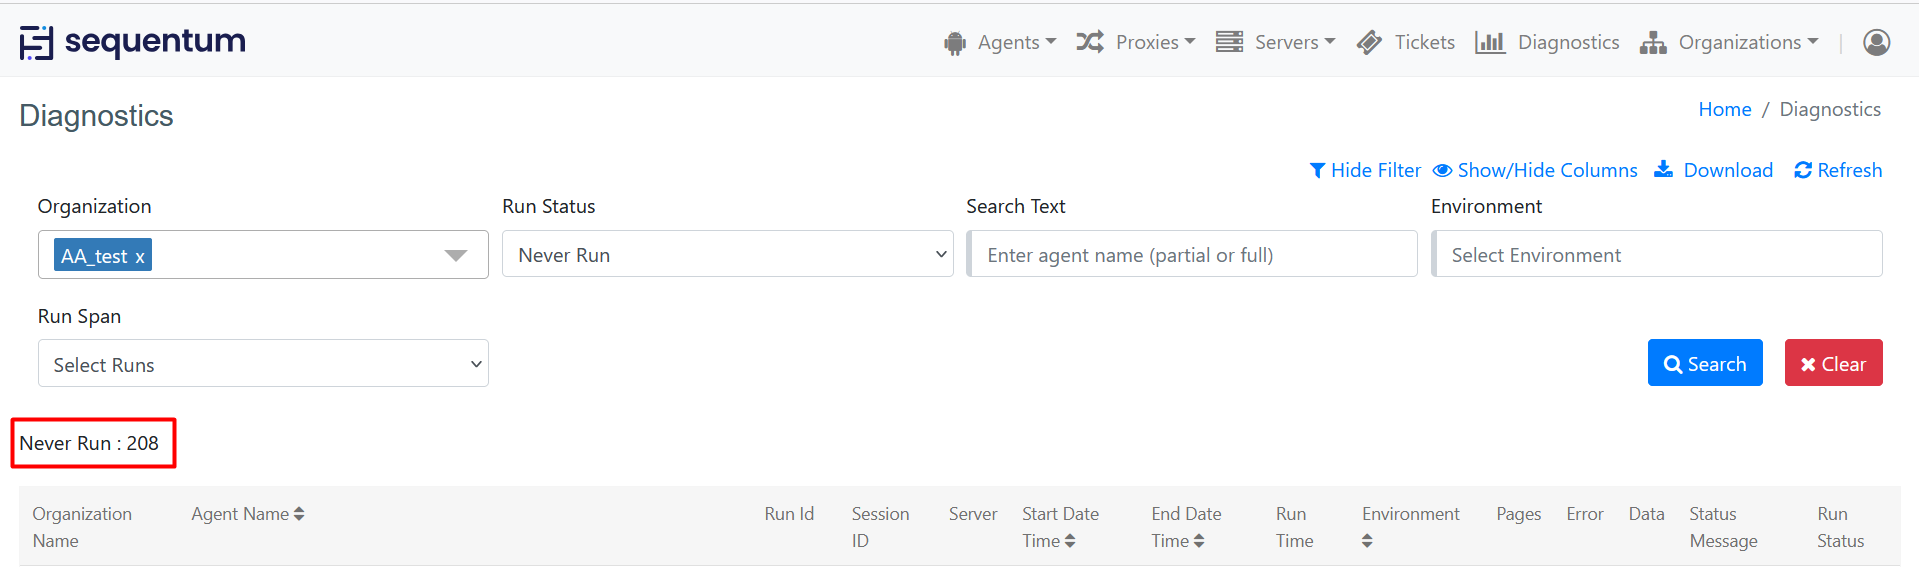
When selecting "All Status" in the Run Status filter, "Never Run" status will not be included. To view "Never Run" statuses, select "Never Run" explicitly.
If "Active Runs Only" is selected in Run Span, it overrides the Run Status filter and displays only active runs.
Example Usage
Filtering by Organization:
Select one or multiple organizations using checkboxes.
Filtering by Run Status:
Choose a status such as "Running" or "Failed" to filter results accordingly.
Searching by Agent Name:
Enter part of an agent name to find specific results.
Filtering by Date Range:
Select a predefined range like "Runs for Today" or specify a custom date range.
Viewing Results:
After applying filters, the table updates to show agent runs that match the selected criteria.
Troubleshooting
Issues: If results do not appear as expected, check that filters are correctly applied and that the search text matches existing agent names.
Display the counts on Diagnostic Page
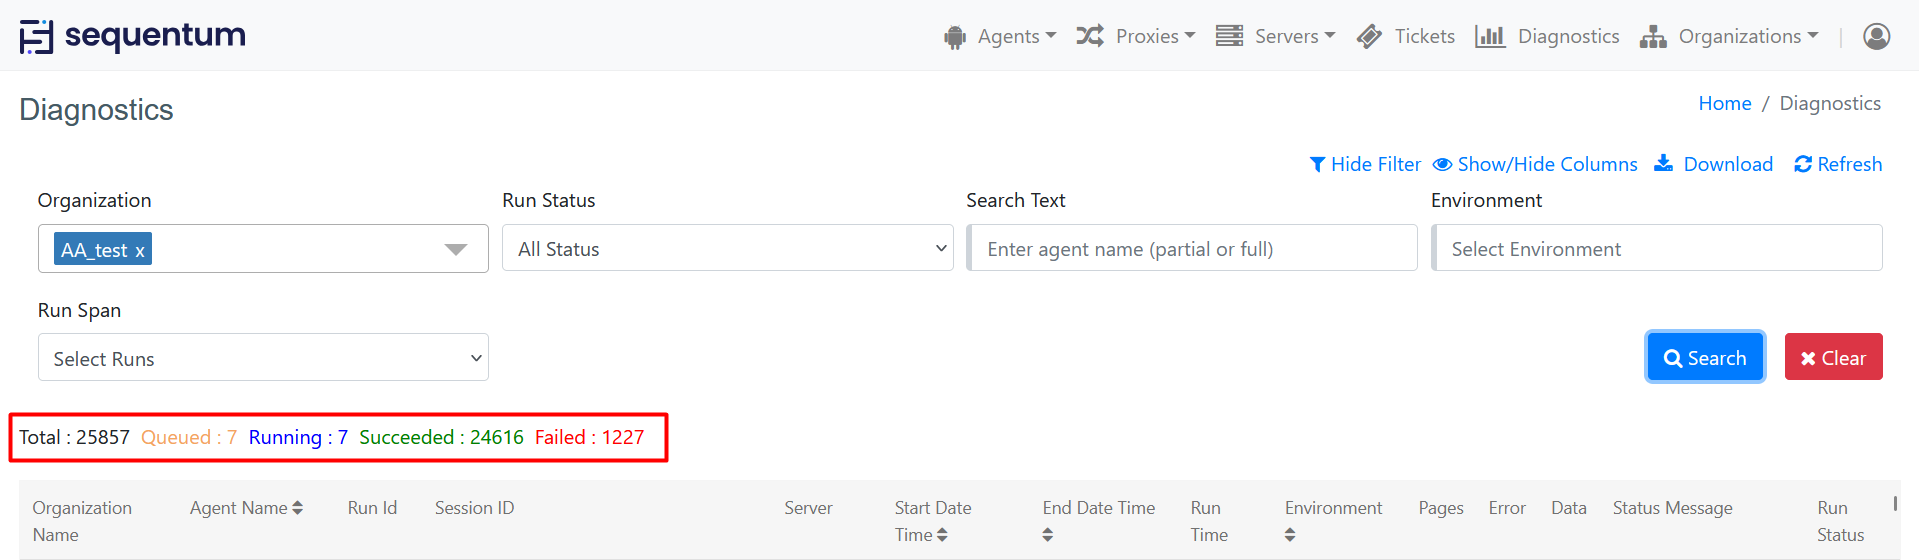
The Enhanced Summary Report on the Diagnostic Page provides a clear snapshot of your agents' performance based on your chosen search criteria. Here’s how to use and understand this feature:
When you access the Diagnostic Page use the searches criteria, you will see a summary report that consolidates the following data:
Total Number of Agents: Displays the total count of agents that match your current search criteria.
Count of Successful Runs: Shows how many times agents have successfully completed their tasks.
Count of Failed Runs: Indicates the number of times agents encountered issues or errors.
Count of Running Agents: Displays how many agents are currently active and running.
Count of Queued Agents: Shows the number of agents waiting for their turn to run.
Count of Agents that Have Never Run: Indicates how many agents have never been used or have no execution history.
Using Search Filters
Default View: Initially, the summary will show counts for agents that are currently running.
Selecting Specific Statuses: You can choose to view counts for agents in different statuses (Running, Failed, Queued, Succeeded, Never Run) individually by selecting each status and clicking the search button.
All Statuses: When you select "All" statuses, the summary will display counts for all statuses except "Never Run". This helps you get an overview of the active and historical performance of your agents.
Only Never Run: If you select "Never Run" exclusively, the report will specifically show agents that have never been executed.
Each count is updated in real-time based on your selected criteria. If no agents match a specific status (e.g., no failed runs), it will display as "0".
Download Search Data :
You can download your search results as a .CSV file from the Diagnostic page. On Diagnostics page Enter your search criteria and click Search. Now click on the Download button. The .CSV file will automatically download to your system.
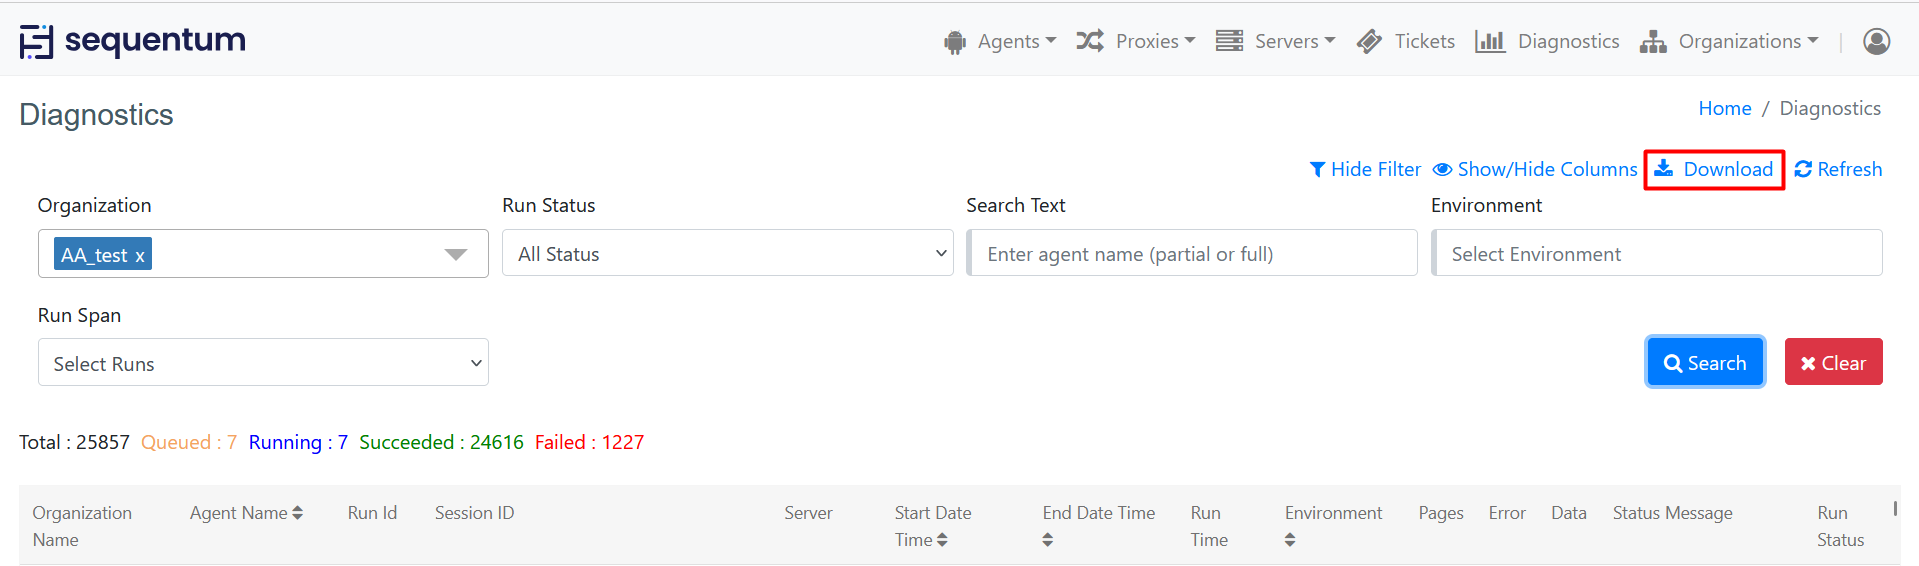
All headers will be displayed in file as Headers.
Show/Hide Columns: This feature allows you to customize the columns displayed on the diagnostic page, giving you control over what column you want to see. You can hide or display specific columns based on your preferences.
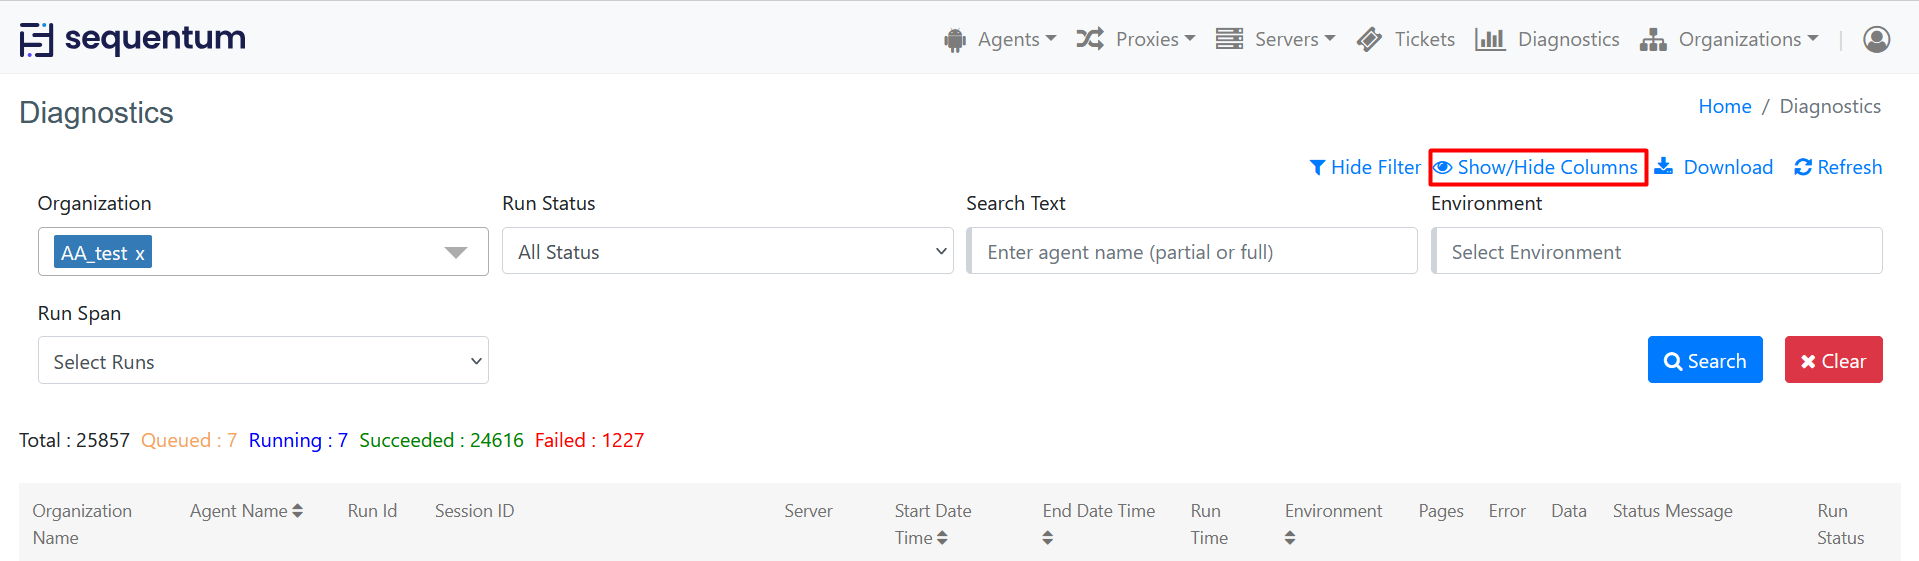
When you will click on “Show/Hide Columns” option , a window will open for the choose column menu as shown below -
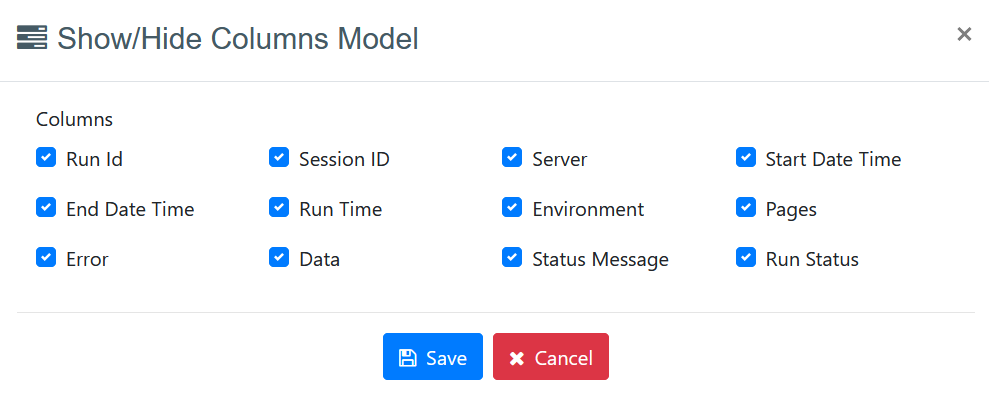
In the Column Filter window, you will see a list of all available columns with checkboxes. To display a column, check the corresponding checkbox. To hide a column, uncheck the checkbox. After selecting your desired columns, be sure to save your changes by clicking on "Save" button in the Column Filter window. Once you save your changes, the diagnostic page will update to display only the columns you selected.